Having some troubles to recover a “Volkszähler” system (server doesn’t exists any more), I decided to build my own Smart Meter system, user friendly, small footprint and simple to maintenance.
The concept: S0 Impulses are counted via interrupt on a microcontroller (ESP32) and sent to a Web-server running on a Rasperry Pi. Every time, after 60 seconds, three counter values (for each phase of the power lines) are written into a Round Robin Database (RRD) file. The graph function of RRDtool is used to present this data to a human viewer via Web-Browser.

The hardware configuration: ESP32 ->(WLAN)->RPI2
Software requirements (RPI): apache2, RRDtool, php7.3, php7.3-gd
Skipping the microcontroller part (data is sent with a simple http-request http://<address-of-rpi>/s0.php?data=<counter1>:<counter2>:<counter3>) here are the steps and the software parts of the smart meter:
STEP 1: Defining the database (RRD):

Each minute the power line counter values are written into the database, Format: ‘R:S:T’
There are three archives in this database: one for the original data (minutes) holding the values for 10 days, one for reduced hour-values holding 18 months, and one for reduced daily-values holding 10 years.
Step 2: Script to permanently update the database:

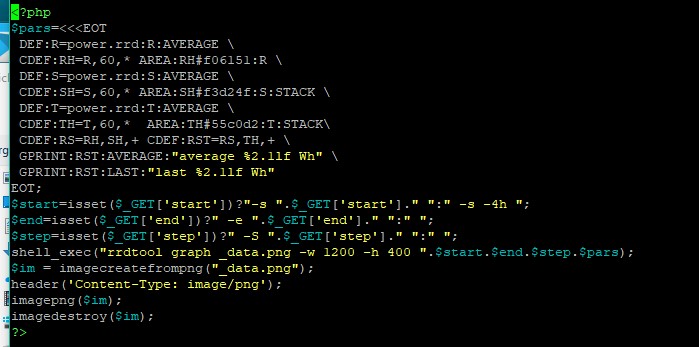
Step 3: Script to visualize the data: Call this script with three optional query parameters: start, end, step. start: point where to begin viewing data i.e -1d -2M -4h, default 4h (4 hours). end: point where to stop viewing data (default now). step: resolution in seconds (default 60). Example: http://<rpi-address>/data.php?start=-2d&end=-1d
